02. Sobel Operator
Sobel Operator
The Sobel operator is at the heart of the Canny edge detection algorithm you used in the Introductory Lesson. Applying the Sobel operator to an image is a way of taking the derivative of the image in the x or y direction. The operators for Sobel_x and Sobel_y , respectively, look like this:
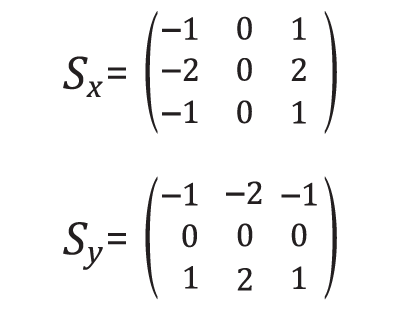
These are examples of Sobel operators with a kernel size of 3 (implying a 3 x 3 operator in each case). This is the minimum size, but the kernel size can be any odd number. A larger kernel implies taking the gradient over a larger region of the image, or, in other words, a smoother gradient.
To understand how these operators take the derivative, you can think of overlaying either one on a 3 x 3 region of an image. If the image is flat across that region (i.e., there is little change in values across the given region), then the result (summing the element-wise product of the operator and corresponding image pixels) will be zero.
For example, given:
The element-wise product would be:
In which case, the sum of this matrix is 0 , implying a flat gradient (in the x-direction in this calculation, although the y-direction is also zero in this example).
If, instead, for example, you apply the S_x operator to a region of the image where values are rising from left to right, then the result will be positive, implying a positive derivative.
Given:
The element-wise product would be:
This time, the sum of this matrix is 8 , meaning a gradient exists in the x-direction. Note that in this example image region, if you applied the S_y operator, the result would be a gradient of 0 in the y-direction, as the values are not varying from top to bottom.
Visual Example
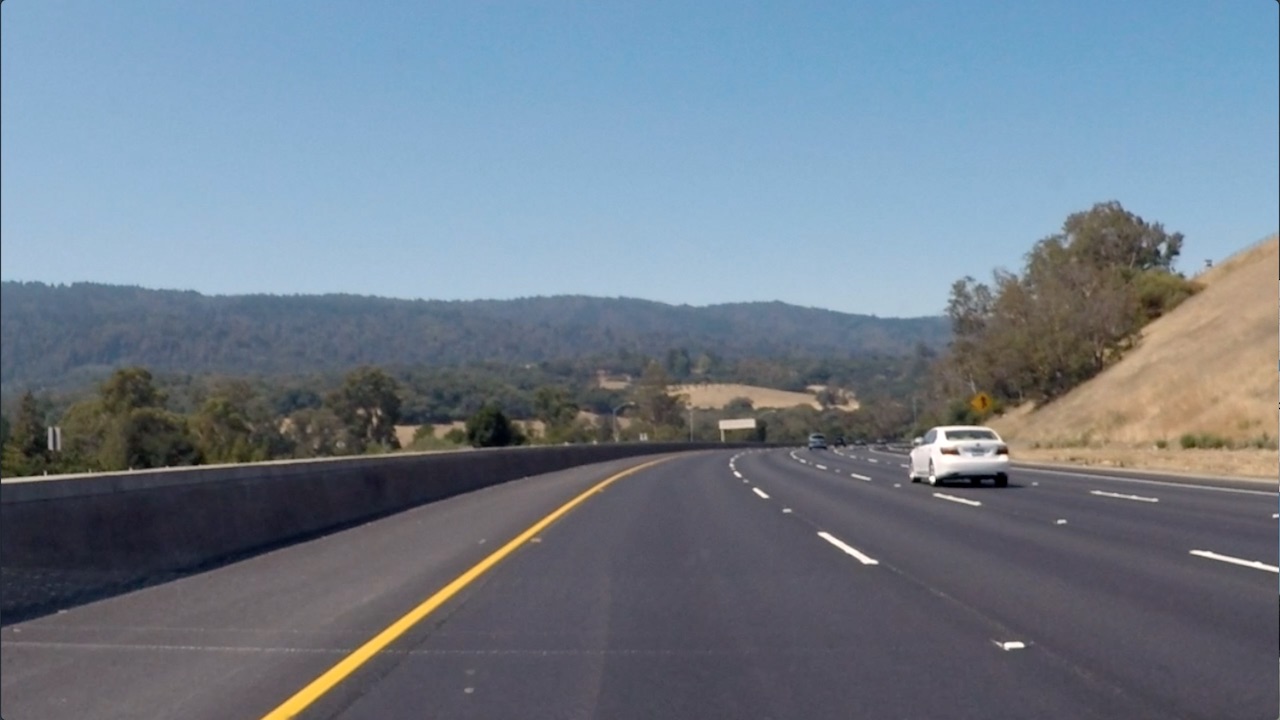
If we apply the Sobel x and y operators to this image:
And then we take the absolute value, we get the result:
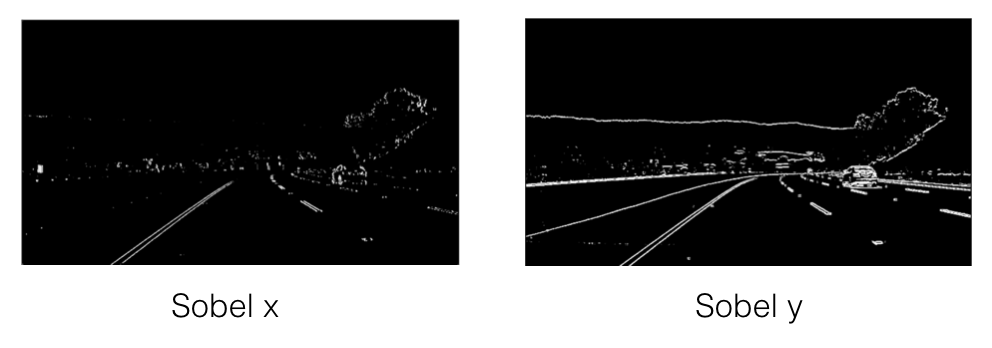
Absolute value of Sobel x (left) and Sobel y (right).
x vs. y
In the above images, you can see that the gradients taken in both the x and the y directions detect the lane lines and pick up other edges. Taking the gradient in the x direction emphasizes edges closer to vertical. Alternatively, taking the gradient in the y direction emphasizes edges closer to horizontal.
In the upcoming exercises, you'll write functions to take various thresholds of the x and y gradients. Here's some code that might be useful:
Examples of Useful Code
You need to pass a single color channel to the
cv2.Sobel()
function, so first convert it to grayscale:
gray = cv2.cvtColor(im, cv2.COLOR_RGB2GRAY)
** Note: ** Make sure you use the correct grayscale conversion depending on how you've read in your images. Use
cv2.COLOR_RGB2GRAY
if you've read in an image using
mpimg.imread()
. Use
cv2.COLOR_BGR2GRAY
if you've read in an image using
cv2.imread()
.
Calculate the derivative in the x direction (the 1, 0 at the end denotes x direction):
sobelx = cv2.Sobel(gray, cv2.CV_64F, 1, 0)Calculate the derivative in the y direction (the 0, 1 at the end denotes y direction):
sobely = cv2.Sobel(gray, cv2.CV_64F, 0, 1)Calculate the absolute value of the x derivative:
abs_sobelx = np.absolute(sobelx)Convert the absolute value image to 8-bit:
scaled_sobel = np.uint8(255*abs_sobelx/np.max(abs_sobelx))** Note: ** It's not entirely necessary to convert to 8-bit (range from 0 to 255) but in practice, it can be useful in the event that you've written a function to apply a particular threshold, and you want it to work the same on input images of different scales, like jpg vs. png. You could just as well choose a different standard range of values, like 0 to 1 etc.
Create a binary threshold to select pixels based on gradient strength:
thresh_min = 20
thresh_max = 100
sxbinary = np.zeros_like(scaled_sobel)
sxbinary[(scaled_sobel >= thresh_min) & (scaled_sobel <= thresh_max)] = 1
plt.imshow(sxbinary, cmap='gray')
** Result **
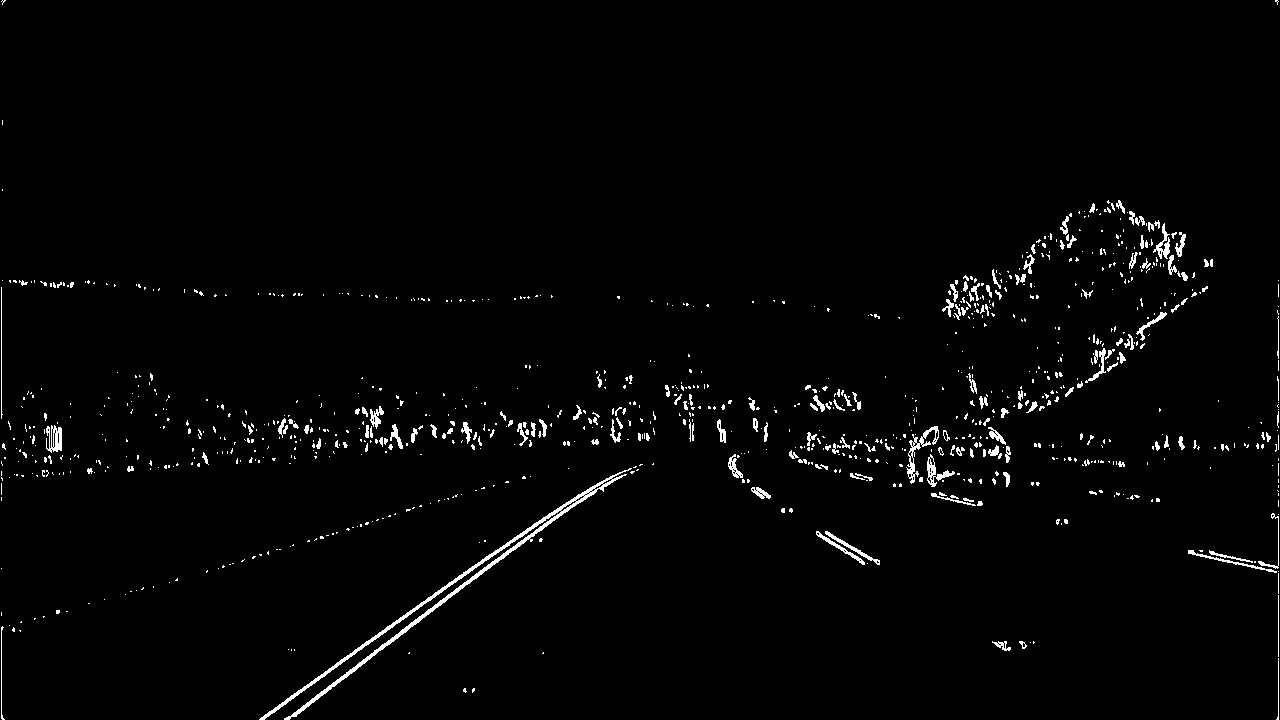
Pixels have a value of 1 or 0 based on the strength of the x gradient.